To recap, the topic of discordant redshifts is the idea that the redshifts of extragalactic objects may not be a reliable indicator of the object's distance via the Hubble Law, and that many high-redshift quasars are physically very close to nearby regular galaxies.
There are three primary lines of evidence supporters of this interpretation argue:
- The claimed low-probability of such alignments and associations
- A correlation that higher-redshift objects tend to be closer to the foreground galaxy. That is, the apparent separation on the sky, theta, is inversely correlated with the redshift of the quasar, z_q
 (Equation 1)
 - Apparent connections between the high and low-redshift objects
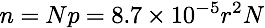
I had actually followed this topic for a number of years. One of the most annoying issues I found with every paper advocating discordant redshifts was the chronic quoting of probabilities of a given distance or alignment with no clear information on precisely how this quantity was computed - the equation, and the input values. Recently I did find what is apparently the original source paper for these calculations, by Burbidge, Burbidge, Solomon and Strittmatter, often referred to as the B2S2 paper, Apparent Associations Between Bright Galaxies and Quasi-Stellar Objects. The relevant equations are 1 & 2 from this paper.
where lambda is space density of galaxies PER SQUARE DEGREE. The average number of close association you would expect to detect,n, in the region around the galaxy becomes:
 (equation 3)
for sample of N galaxies within an angular radius r (measured in arcminutes, and corresponds to the same parameter as theta in equation 1 above).
As recently as 1990 (Associations between quasi-stellar objects and galaxies), Burbidge was still using these probabilities, and arguing item 2, that the theta-z correlation cannot happen in the cosmological interpretation.
The most serious problem with these probability computations is that they treat the probability distribution of galaxies on the sky as if it were strictly a 2-dimensional sphere covered with random points. The galaxy density is even measured in SQUARE DEGREES. It also assumes that all these points are equivalent, and independent of redshift, brightness.
But galaxies in the cosmos are actually distributed in a 3-dimensional (okay, actually 4-dimensional) space. Their visibility is determined not just by their position on the sky, but by their brightness as well. This creates a bias known among astronomers as the Malmquist bias (wikipedia). This is the reason why the stars we see in the night sky are not representative of all stars, but biased by bright, giant stars, which can still be seen even when they are much, much farther away.
So it is with quasars and QSOs in the standard cosmological model.
 |
| Slice of the sky created by the observer's field-of-view |

 (equation 4)
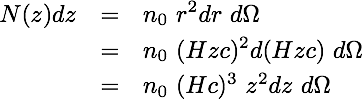
If we consider the volume of space between the foreground galaxies at r0, and background galaxies, r1 (between redshifts of z_0 and z_1, respectively), we find
We get several interesting consequences from this result.
- For a given field of view, we will count more galaxies with increasing redshift, z. For a given range of redshift, the number of galaxies will increase at the SQUARE of the redshift value. In other words, in a field where we count 10 galaxies with redshift z=0.0-0.01, then on average, we should see 1000 galaxies with z=0.10-0.11!
- The results are even more dramatic when we consider the entire volume of space, comparing the number of galaxies z=0.0 to z=0.01 with from z=0.01 to z=0.11. Using equation 5 above, if we find 10 galaxies between z=0.0 to z=0.01, there are almost 10,000 more galaxies in the same field of view, if we sample out to z=0.1!
- The side effect of (1) is that, if for a fixed area of sky, the number of galaxies in that section of sky increases as z^2. Therefore the average projected angular distance between those galaxies for a given redshift *decreases* with increasing redshift, so d is proportional to 1/z.
This is the effect which Arp, Burbidge, and other discordant redshift supporters claim cannot happen in the standard cosmological model! Yet it is a simple aspect of a distribution of uniform points in a 3-dimensional volume!
Now this example was so simple, I was astonished that, with all the papers on discordant redshifts I'd read, I had been unable to find this derivation anywhere else. Certainly someone else had recognized this simple analysis!
I had a very difficult time trying to find a paper with an equivalent analysis, until very recently, when I found a paper by López-Corredoira & Gutierrez (The field surrounding NGC 7603: Cosmological or non-cosmological redshifts?). This paper made a passing reference to a 1975 paper by P.D. Noerdlinger (Reexamination of the correlation of galaxies and QSO's ), which did reproduce the analysis above, and more!
As of this writing, the Noerdlinger paper has been cited a mere five times. Only two of those citations by those advocating discordant redshifts, and they only mention the paper, not addressing the challenge it creates for their interpretation of redshift. It illustrates the dilemma I pointed out in Why Don't Rebuttals Appear in Scientific Literature? about how rebuttals to bad science receive very little recognition.
Next, turning the math above into pictures.
Update 5/27/2013: Minor edits.
2 comments:
I don't understand your problem with Creationism and Astronomy! There is NO such problem,if one looks at the Universe and the earth as being very, very ancient as so spelled out in the Bible. And as your own calculus equations so handsomely point out! One only need look at the Scriptures in light of the facts of nature, both terrestrial and extraterrestrial to see there is NO real problem with the Old earth Creationist viewpoint!
To Lawrence,
While there are some Old Earth Creationists (Reasons To Believe, etc.), the majority of people calling themselves Creationist in the United States are the Young Earth variety (Institute for Creation Research, Answers In Genesis, etc.).
I have some disagreements with the Old-Earth variety, but I regard them as less of a problem as they mostly argue with biologists...
Tom
Post a Comment